¶ Device Status
Three pages at the top of the web interface’s menu show how the Defend-O-Tron itself is doing:
| Page | What it shows |
|---|---|
| Overview | The device at a glance: model, firmware, memory, storage and temperatures, with trends and health checks |
| Services | The programs that run on the device, what it runs on a schedule, and what it listens on |
| Monitoring | How hard the device is working now, and the programs that collect the figures behind the charts |
Everything is drawn on the device itself, and nothing is fetched from the internet. Viewers can see all three pages. Only administrators can restart the device or change a service.
The figures for the charts come from the device’s metrics store, which keeps them for 90 days on a V100 and 180 days on a V200. The pages reload their data at the Auto refresh interval in the user menu (every minute unless you change it). Click Refresh to read them at once.
For what the device has detected and blocked, see Threat Activity. For the logs, see Logs.
¶ Overview
Overview opens when you sign in. Its Status tab shows:
- Model, Host name, Uptime and Load (1, 5, 15 min).
- Memory used and Swap used, with how full each one is.
- Device: the platform and board, the serial number, the firmware and the running image, the kernel, the time zone, the device’s time, and Clock synchronised. no (in orange) means the clock is not set from the network, so times in logs and reports can be wrong. Administrators also see the Time zone config link. See Time zone.
- Storage: how full each of the device’s file systems is.
- Temperatures: the hottest sensor on each part, over the period chosen under Trends.
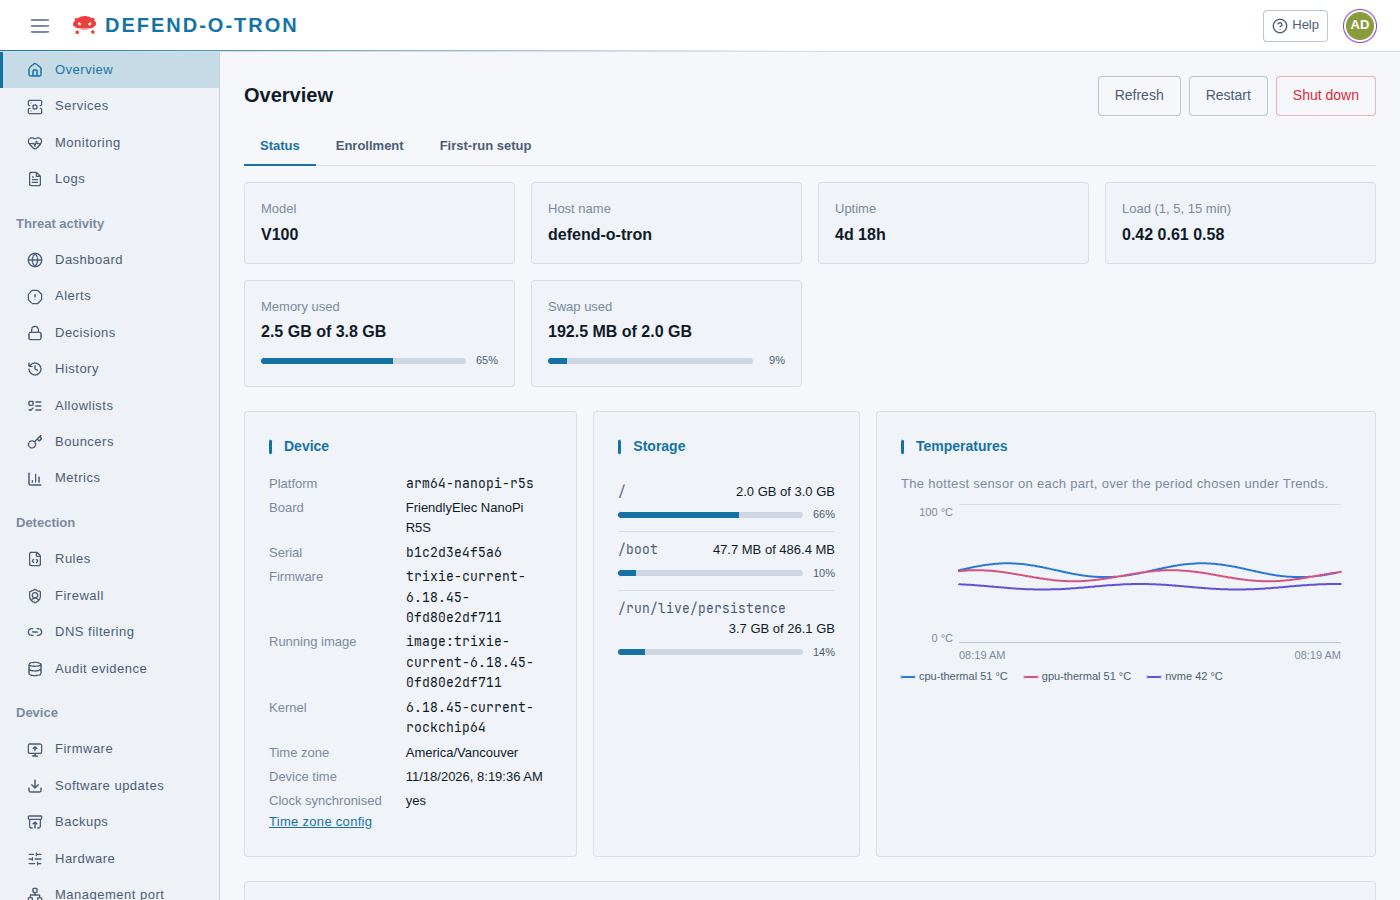
Administrators also see the Restart and Shut down buttons (see Restart and shut down), and two more tabs:
- Enrollment: the device’s identity and its link to the support console, and Install for an identity file. See Enrollment.
- First-run setup: Run setup again. See Running Setup Again.
¶ Trends
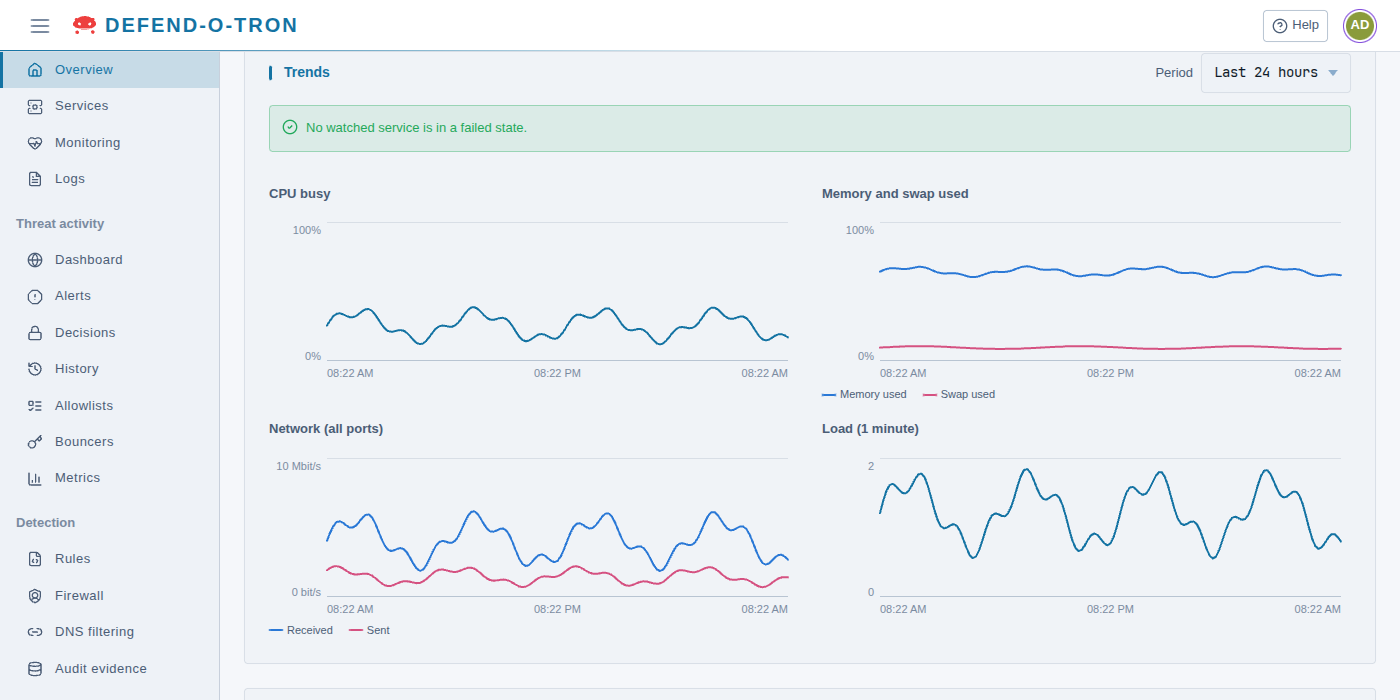
Choose the period at the top right of the card, from the Last hour to the Last 30 days (24 hours by default). It applies to the Trends, Health and Temperatures charts.
At the top of the card, a notice says if a protection service has failed: These services failed and have not started cleanly since. Their part of the protection may be down, with their names. The services it watches are Suricata, the CrowdSec firewall bouncer, nftables, ulogd2 (firewall logging), the audit collector and the bridge check. When none has failed, it says No watched service is in a failed state. A service that failed stays on the list until it starts cleanly again, even if it is running now.
The charts: CPU busy, Memory and swap used, Network (all ports) with traffic received and sent, and Load (1 minute).
¶ Health
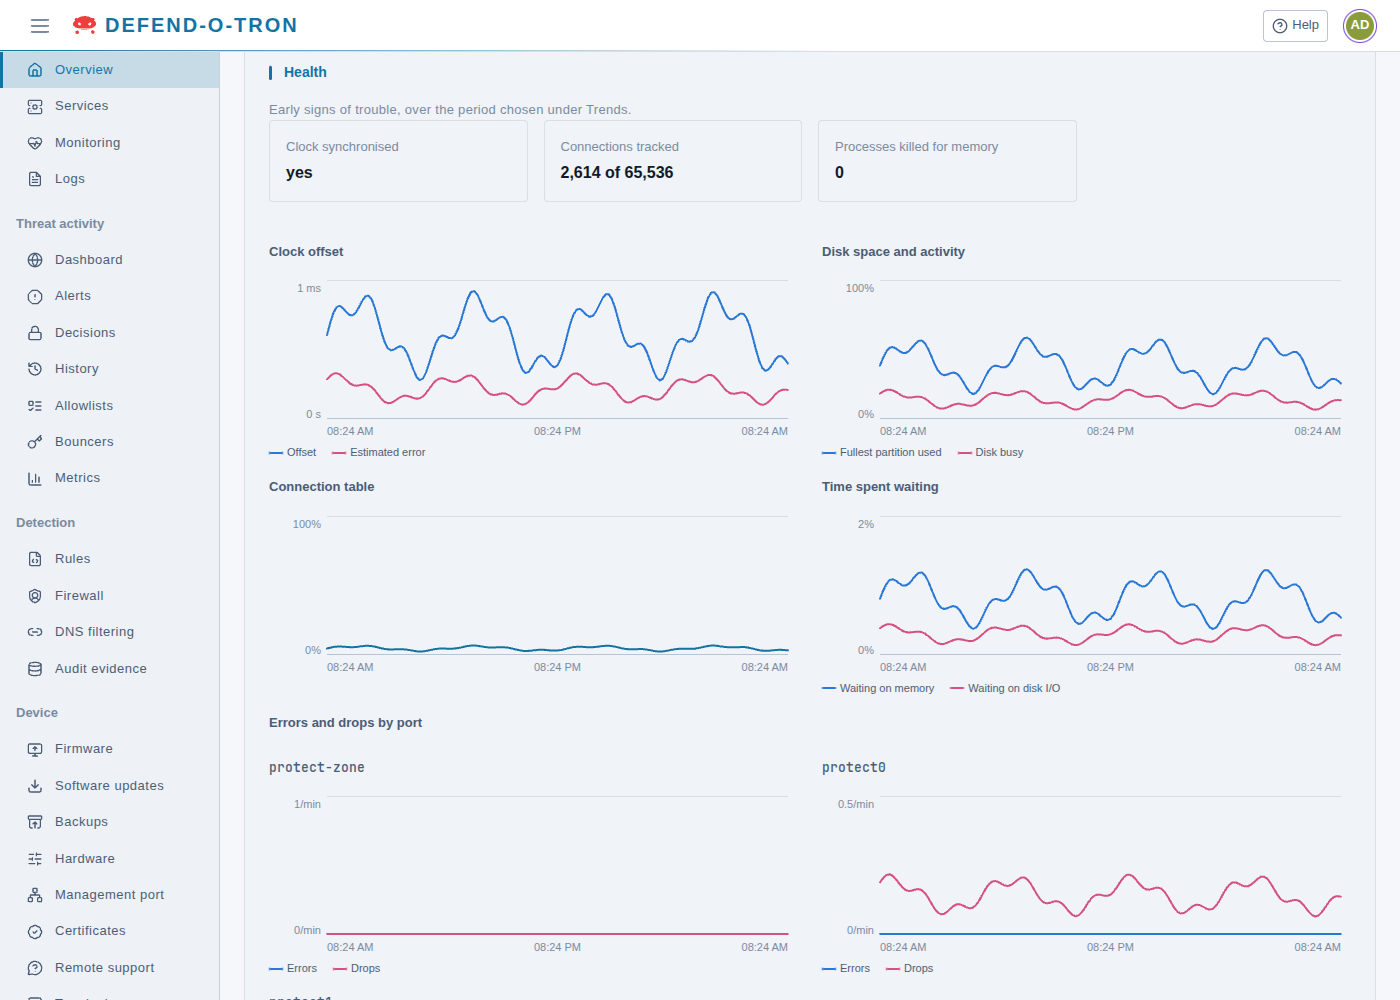
Early signs of trouble, over the same period:
| Figure or chart | What to look for |
|---|---|
| Clock synchronised | no (in orange): the clock is not set from the network |
| Connections tracked | How many network connections the device follows now, out of the most it can follow. Close to the limit, new connections can fail |
| Processes killed for memory | Programs the device stopped because memory ran out. Anything above 0 (in orange) means it is short of memory |
| Clock offset | How far the clock is from true time, and the estimated error. The audit evidence relies on an accurate clock |
| Disk space and activity | How full the fullest file system is, and how busy the disk is |
| Connection table | How full the table of tracked connections is, over time |
| Time spent waiting | How long programs wait for memory or the disk. Rising values mean the device is running short |
| Errors and drops by port | One chart for each port. Steady errors usually mean a bad cable or port |
¶ Services
Services lists the programs (services) that run on the device. It has three tabs: Services, Timers and Sockets.
On the Services tab, type in Filter to find a service by its name or description, or choose a State: all, active, failed or inactive. The list is grouped by state, and the line under it says how many are shown.
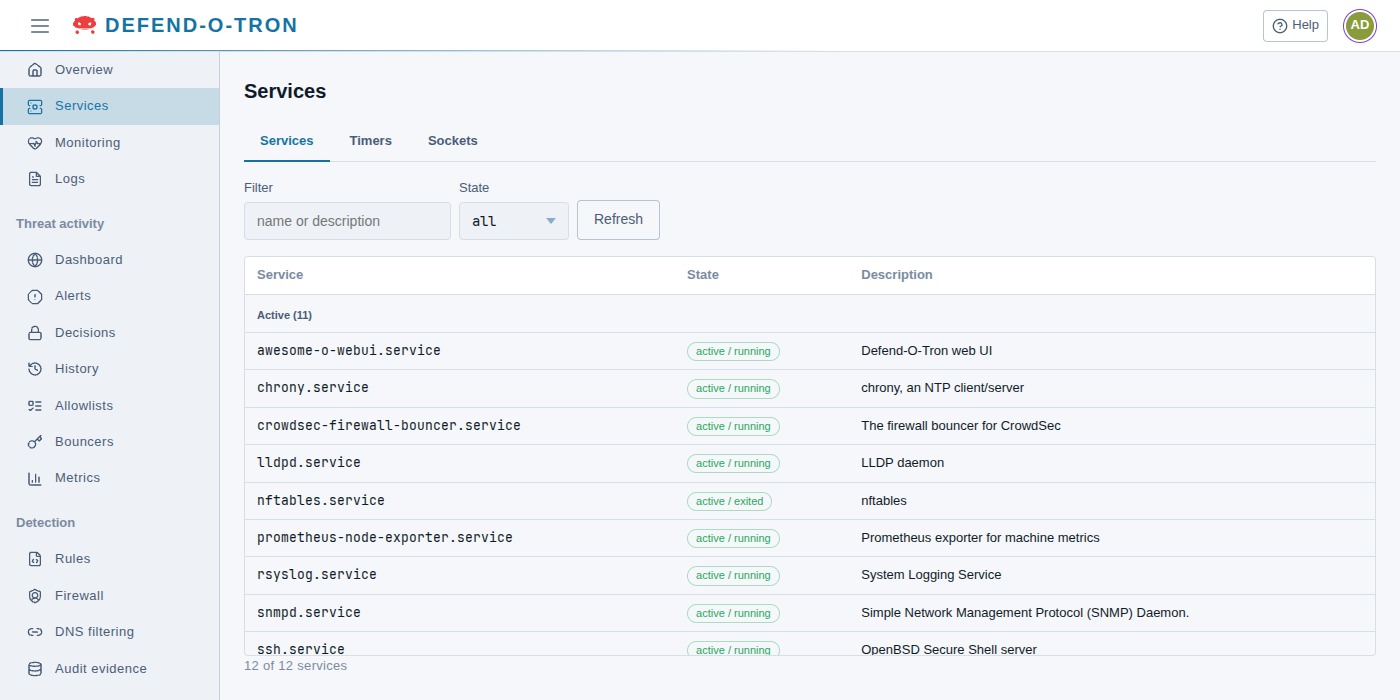
Click a service to see its details: Description, Loaded, State, Enabled, Since, Main PID, Memory, Restarts and Last result. Show this service’s logs opens the Logs page for that service.
Administrators can also Start, Stop or Restart it, and Enable at start-up or Disable at start-up:
- Stop, Restart and Disable at start-up ask you to confirm first.
- A protected service is one the device depends on, such as Suricata, nftables, the CrowdSec firewall bouncer, the network and SSH. Any change to it asks you to type its name, because a mistake here can interrupt protection or lock you out.
- SSH, the web interface and the audit collector cannot be stopped or disabled from this page. Without them you could not reach the device, or it would stop keeping its record.
- The web interface’s own helper services cannot be changed here.
Every change is recorded in the audit log, on the Admin actions tab of Audit Evidence.
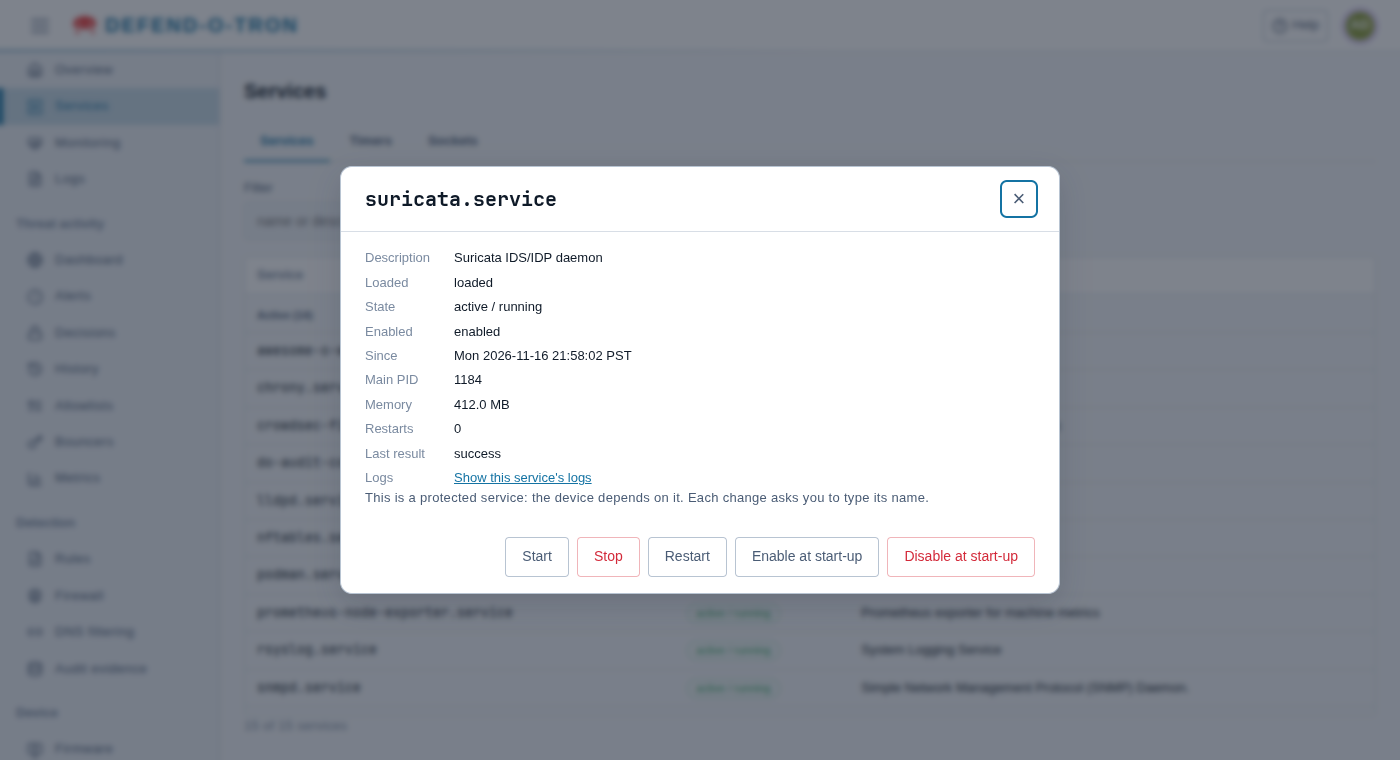
Stopping the wrong service can cut your connection or your protection. The Defend-O-Tron sits inline: your internet traffic passes through it. Change a protected service only when Awesome-O support or a page on this wiki tells you to.
Timers shows what the device does on a schedule: Timer, Runs (the service it starts), Last ran, Next run and State. Sockets shows what the device listens on: Socket, Listens on, Starts and State. Both are read-only. To run a timer’s job now, start the service it runs from the Services tab.
¶ Monitoring
Monitoring shows how hard the device is working right now, and the programs that collect the figures behind the charts on these pages. It has a Summary tab and one tab for each source of figures.
Choose the period at the top right, from the Last hour to the Last 30 days (24 hours by default), or Custom… for any period from 10 minutes to 31 days. The Summary tab has no period, because it shows the device as it is now.
¶ Summary
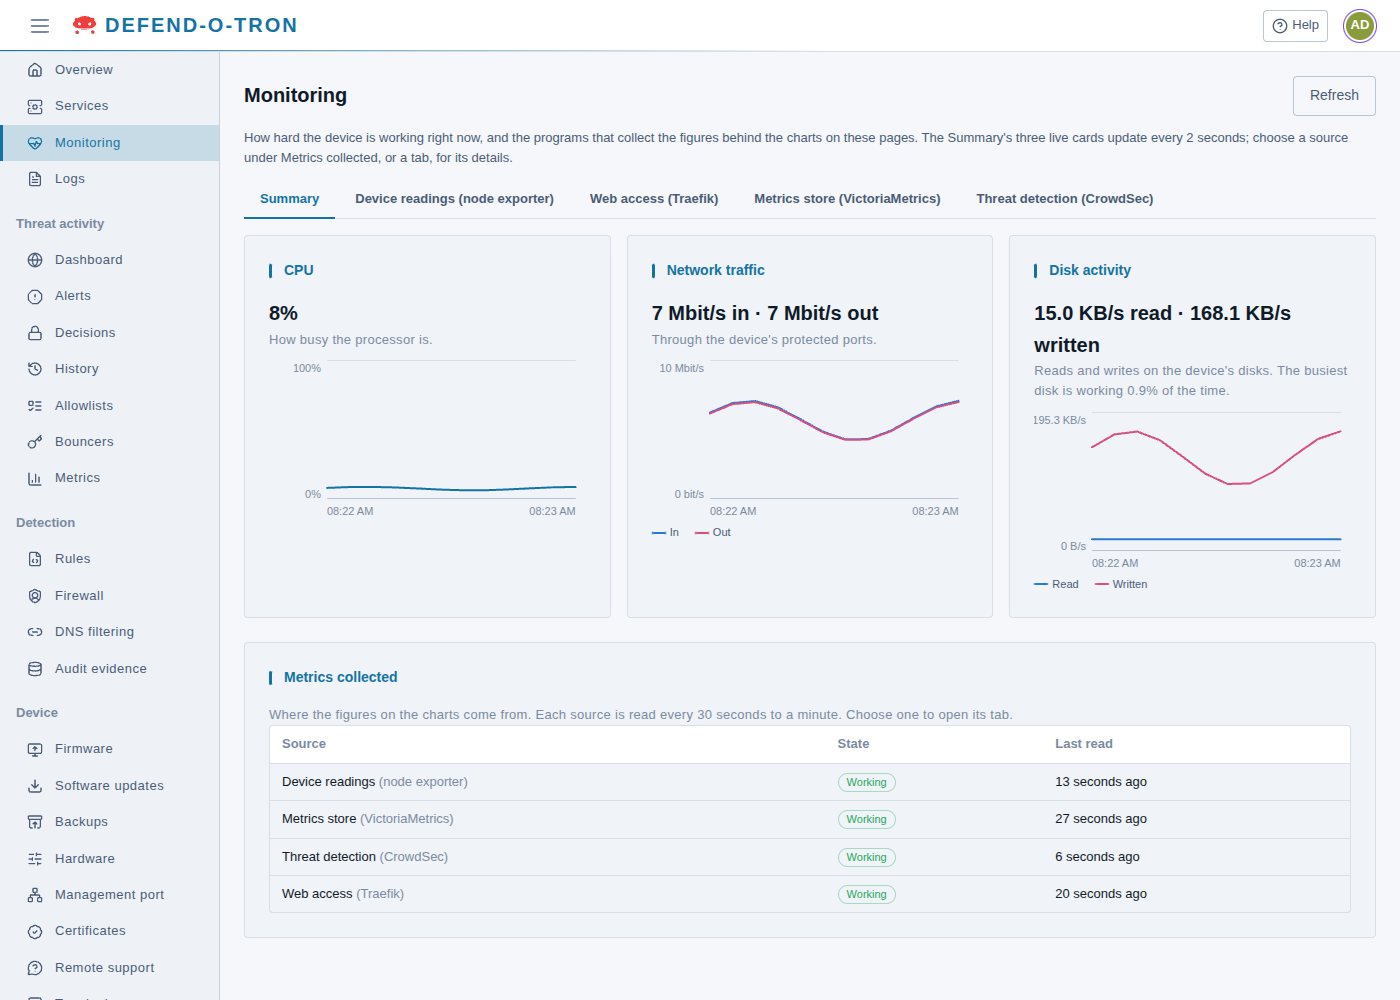
The CPU, Network traffic and Disk activity cards update every 2 seconds:
- CPU: how busy the processor is.
- Network traffic: in and out through the device’s protected ports.
- Disk activity: reads and writes on the device’s disks, and how much of the time the busiest disk is working.
Metrics collected lists where the figures on the charts come from, with State (Working or Not reporting) and Last read. Each source is read every 30 seconds to a minute. Choose a source to open its tab. A source that is Not reporting leaves gaps in the charts that use it.
¶ Device readings (node exporter)
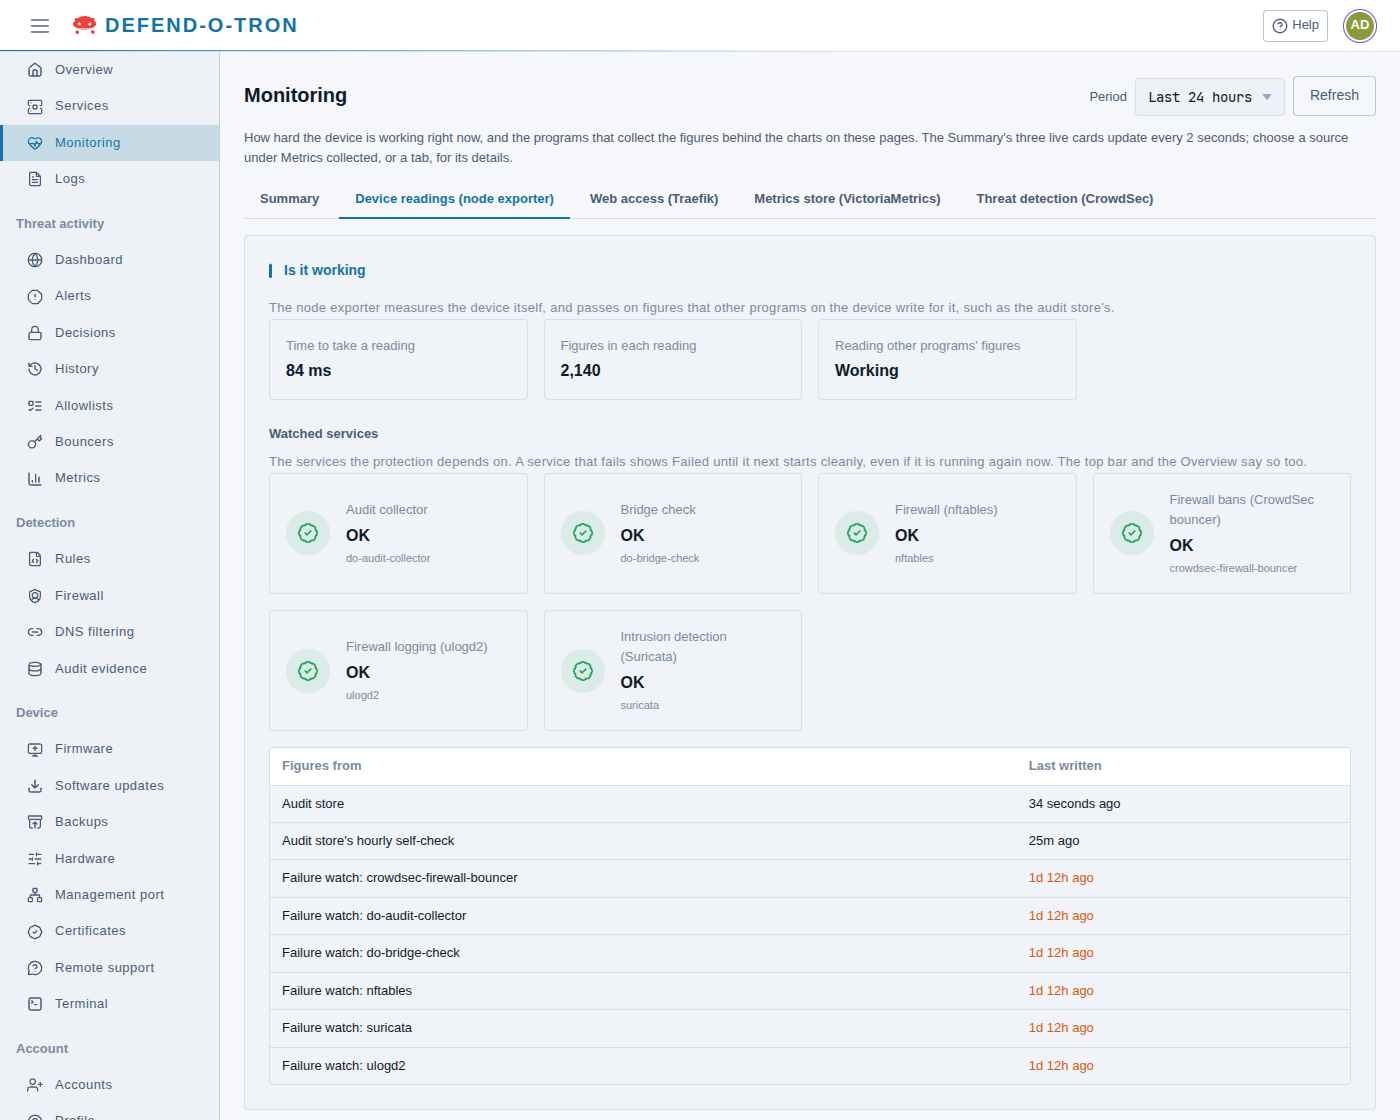
The node exporter measures the device itself, and passes on figures that other programs on the device write for it.
- Is it working: Time to take a reading, Figures in each reading, and Reading other programs’ figures (Working or Failing).
- Watched services: the services the protection depends on, each OK or Failed. The same list as the notice on the Overview page. A service that fails shows Failed until it next starts cleanly, even if it is running again now.
- Figures from: the files of figures other programs write, and when each was last written. The audit store’s figures are written every minute, and its self-check’s every hour. The Failure watch files are written only when their service starts or fails, so an old time there is normal, even though it shows in orange.
- In detail: charts of Memory (programs, file cache, kernel and swap), Open files and processes with the most open files the device allows, Disk reads and writes, by disk, and Network traffic, by port. The ports are the protected ports and their bridge,
protect-zone. The management port is not measured.
¶ Web access (Traefik)
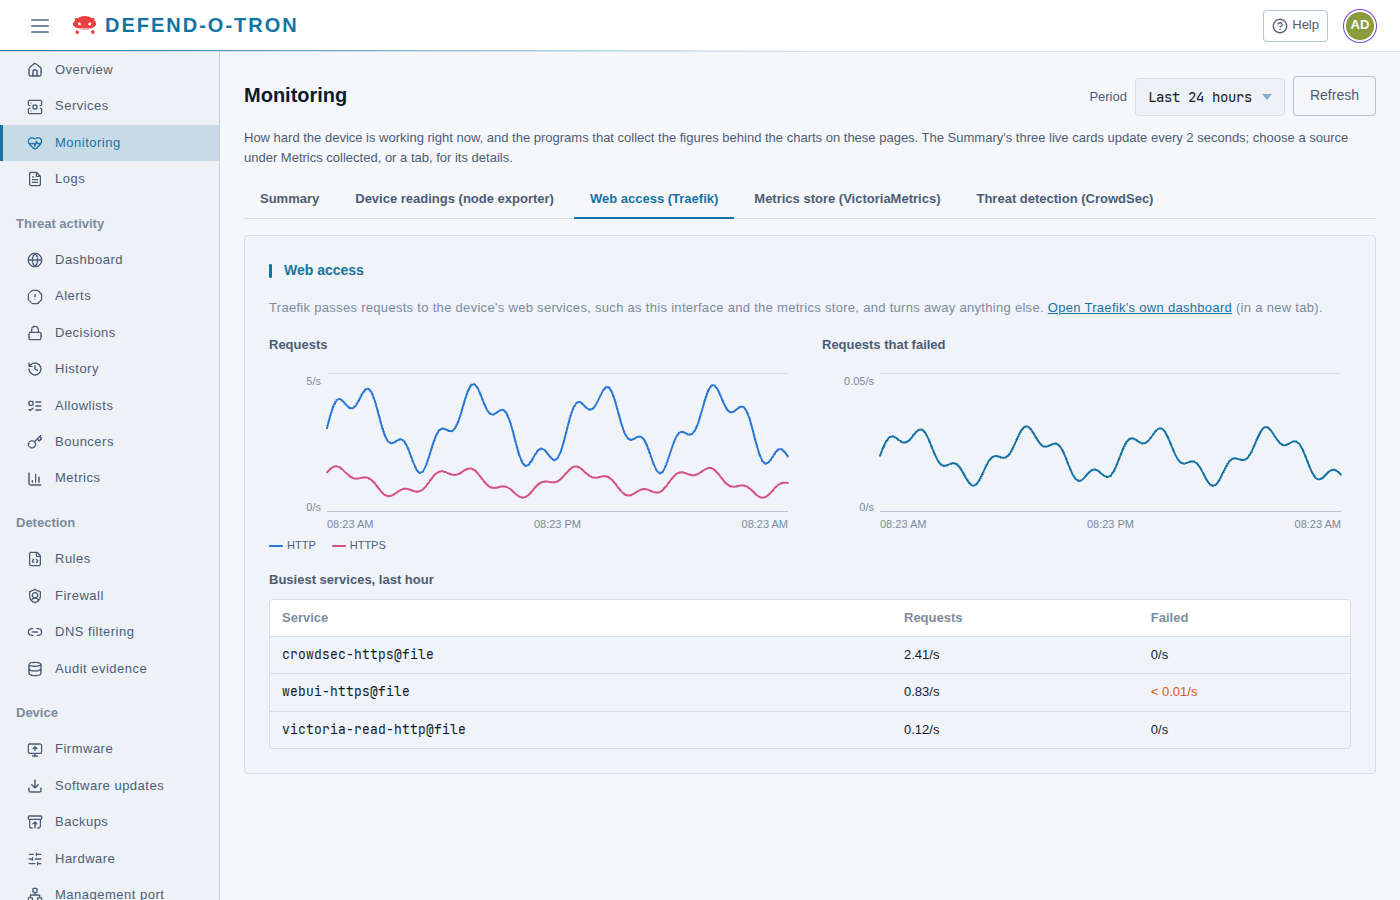
Traefik passes requests to the device’s web services, such as this interface and the metrics store, and turns away anything else. The tab shows Requests (HTTP and HTTPS), Requests that failed, and the Busiest services, last hour with their requests and failures per second. Open Traefik’s own dashboard opens it in a new tab.
Traefik uses the device’s own certificates. To make your browser trust them, install the Root CA.
¶ Metrics store (VictoriaMetrics)
VictoriaMetrics keeps the figures for the charts: 90 days on a V100 and 180 days on a V200. The tab shows Figures being tracked, Disk used, Memory and Figures stored (per second), and a chart of the figures stored per second.
¶ Threat detection (CrowdSec)
Shown only if you can see Threat activity.
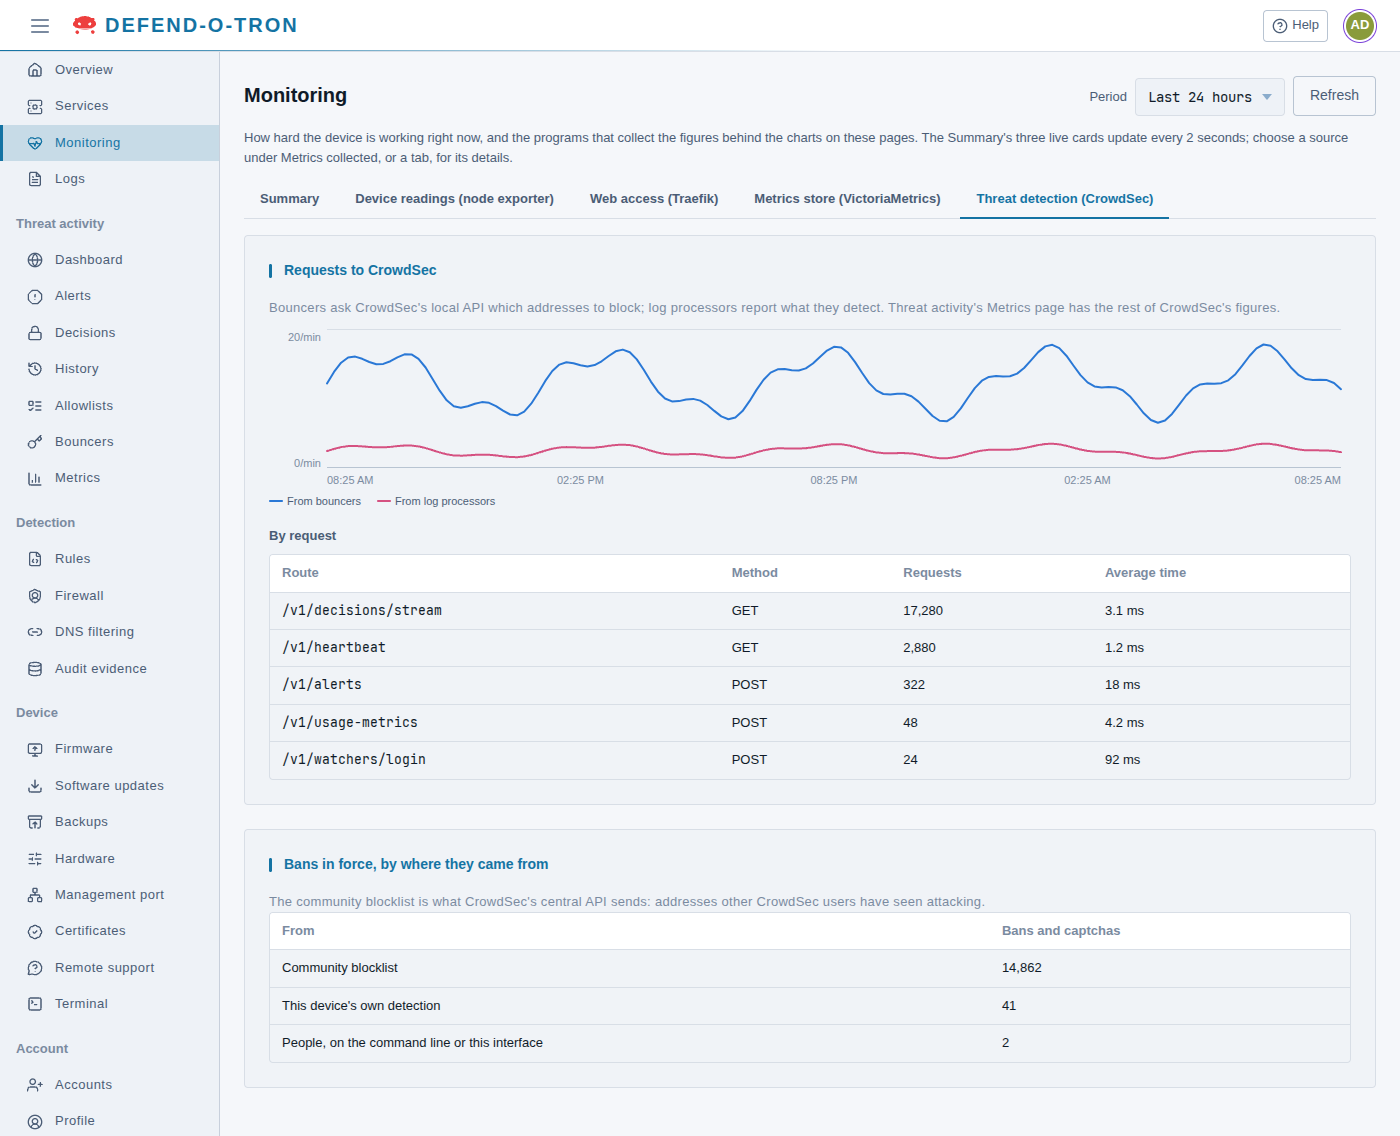
- Requests to CrowdSec: how often bouncers ask CrowdSec which addresses to block, and how often log processors report what they detect. By request lists each route with its requests and average time. A bouncer that stops asking stops receiving new bans: see CrowdSec API.
- Bans in force, by where they came from: the Community blocklist (addresses other CrowdSec users have seen attacking), This device’s own detection, People, on the command line or this interface, People, from the CrowdSec console, and Subscribed blocklists.
For the rest of CrowdSec’s figures, see Metrics.
¶ Related
- Admin Interface: signing in, the menu, restarting the device, and the time zone.
- Threat Activity: what the device has detected and blocked.
- Audit Evidence: the tamper-evident record, and the admin actions.